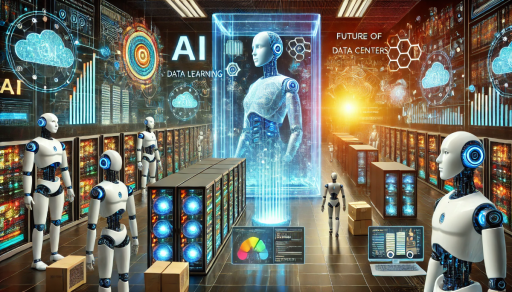
Data visualization is a critical component of data center monitoring, offering a clear and efficient method for presenting complex data sets. Through the use of visual elements like charts, graphs, and maps, data visualization enables data center managers to easily interpret and comprehend large volumes of information. This capability is particularly vital in data center monitoring, where real-time data on server performance, network traffic, and power consumption must be continuously analyzed and acted upon.
Without effective data visualization, data center managers may struggle to identify trends, patterns, and anomalies within the data, potentially leading to delays in issue resolution and negatively impacting overall data center performance. Moreover, data visualization plays a crucial role in communicating insights and findings to organizational stakeholders. By presenting data in a visually appealing and easily understandable format, data center managers can effectively convey the importance of specific trends or issues to executives, IT teams, and other relevant parties.
This facilitates informed decision-making and enables necessary actions to be taken to optimize data center performance. In essence, data visualization is fundamental for enhancing the overall visibility and understanding of data center operations, which is essential for maintaining the reliability and efficiency of the infrastructure.
Key Takeaways
- Data visualization is crucial for understanding complex data in data center monitoring
- Using data visualization in data center monitoring leads to improved decision making and problem-solving
- Data visualization improves data center performance and efficiency by providing clear insights
- Data visualization plays a key role in identifying and resolving data center issues quickly and effectively
- Best practices for implementing data visualization in data center monitoring include choosing the right tools and creating user-friendly dashboards
The Benefits of Using Data Visualization in Data Center Monitoring
Efficient Analysis and Timely Decision-Making
Data visualization enables quick and efficient analysis of large volumes of data, allowing data center managers to easily identify patterns, trends, and outliers that may not be immediately apparent when looking at raw data. This enables them to make timely decisions and take proactive measures to address potential issues before they escalate.
Enhanced Anomaly Detection and Performance Optimization
Data visualization enhances the ability to detect anomalies and performance bottlenecks within the data center. Through the use of visualizations such as heat maps and real-time dashboards, data center managers can quickly spot areas of concern such as server overloads, network congestion, or cooling inefficiencies. This real-time visibility into data center operations is crucial for maintaining optimal performance and preventing downtime.
Improved Collaboration and Communication
Data visualization facilitates better collaboration and communication among different teams within the organization. By presenting data in a visual and intuitive manner, it becomes easier for IT teams, facility managers, and executives to understand the current state of the data center and work together towards common goals. This alignment of efforts is essential for driving continuous improvement and innovation within the data center environment.
How Data Visualization Improves Data Center Performance and Efficiency


Data visualization plays a significant role in improving data center performance and efficiency by providing actionable insights into key operational metrics. Through the use of visualizations such as trend lines, bar charts, and pie graphs, data center managers can gain a deeper understanding of resource utilization, capacity planning, and energy efficiency. This allows them to make informed decisions regarding resource allocation, infrastructure upgrades, and energy management strategies that directly impact the overall performance of the data center.
Furthermore, data visualization enables proactive monitoring and predictive analysis of potential issues within the data center. By visualizing historical performance data and real-time metrics, data center managers can identify patterns that may indicate future problems or bottlenecks. This foresight allows them to take preemptive measures to mitigate risks and optimize performance, ultimately leading to improved operational efficiency and reduced downtime.
Moreover, data visualization supports continuous improvement efforts by providing a clear view of key performance indicators (KPIs) and operational metrics. By tracking these metrics over time through visualizations, data center managers can identify areas for improvement and measure the impact of optimization initiatives. This iterative approach to performance management is essential for driving efficiency gains and ensuring that the data center remains aligned with business objectives.
The Role of Data Visualization in Identifying and Resolving Data Center Issues
Data visualization plays a critical role in identifying and resolving data center issues by providing real-time visibility into key performance metrics. Through the use of visualizations such as line graphs, scatter plots, and histograms, data center managers can quickly identify anomalies or deviations from normal operating conditions. This early detection is crucial for addressing potential issues before they escalate into major problems that could impact service availability or reliability.
Additionally, data visualization enables root cause analysis by allowing data center managers to correlate different sets of data and identify potential relationships between variables. For example, by visualizing server performance metrics alongside environmental sensor readings, it becomes easier to pinpoint the cause of overheating or cooling inefficiencies within the data center. This holistic view of operational data is essential for making informed decisions regarding issue resolution and infrastructure optimization.
Moreover, data visualization supports incident response by providing a clear and intuitive way to track the progression of issues over time. Through the use of visualizations such as timelines and event logs, data center managers can gain a comprehensive understanding of how issues have evolved and been addressed in the past. This historical context is valuable for developing effective response strategies and preventing similar issues from recurring in the future.
Best Practices for Implementing Data Visualization in Data Center Monitoring
When implementing data visualization in data center monitoring, there are several best practices that organizations should consider to maximize its effectiveness. Firstly, it is important to select the right visualization tools and techniques that align with the specific needs and objectives of the data center. This may involve using real-time dashboards for monitoring critical metrics, heat maps for identifying hotspots within the infrastructure, or capacity planning charts for forecasting future resource requirements.
Secondly, organizations should prioritize usability and accessibility when designing visualizations for data center monitoring. Visualizations should be intuitive and easy to interpret for a wide range of stakeholders, including IT teams, facility managers, and executives. This may involve using color coding, interactive elements, and drill-down capabilities to provide deeper insights into the data.
Additionally, it is important to establish clear processes for collecting, analyzing, and presenting data in a visual format. This may involve integrating data from different sources such as monitoring tools, sensors, and management systems to create a comprehensive view of data center operations. Standardizing these processes ensures consistency in the way visualizations are created and used across the organization.
The Impact of Data Visualization on Data Center Management and Decision Making


Enhanced Visibility and Strategic Decision Making
This enhanced visibility into data center operations is essential for making strategic decisions regarding resource allocation, capacity planning, and infrastructure optimization. Data visualization provides data center managers with a clear understanding of their operations, enabling them to make informed decisions that drive business success.
Fostering a Culture of Data-Driven Decision Making
Furthermore, data visualization fosters a culture of data-driven decision making within the organization by providing a common language for interpreting operational metrics. By presenting visualizations that are easy to understand and interpret, data center managers can effectively communicate insights and findings to stakeholders across different departments. This alignment of understanding is crucial for driving consensus on key initiatives and ensuring that decisions are based on accurate and reliable information.
Driving Continuous Improvement
Moreover, data visualization supports continuous improvement efforts by providing a clear view of key performance indicators (KPIs) and operational metrics. By tracking these metrics over time through visualizations, data center managers can identify areas for improvement and measure the impact of optimization initiatives. This iterative approach to performance management is essential for driving efficiency gains and ensuring that the data center remains aligned with business objectives.
The Future of Data Visualization in Data Center Monitoring
The future of data visualization in data center monitoring is poised for significant advancements as organizations continue to leverage emerging technologies such as artificial intelligence (AI) and machine learning (ML) to enhance their monitoring capabilities. These technologies enable more sophisticated analysis of operational data and can provide predictive insights into potential issues before they occur. As a result, we can expect to see more advanced visualizations that incorporate predictive analytics to help data center managers anticipate and proactively address potential issues.
Furthermore, the integration of augmented reality (AR) and virtual reality (VR) technologies into data center monitoring is likely to revolutionize the way operational data is visualized and analyzed. These immersive technologies have the potential to provide a more interactive and intuitive way to explore complex datasets and gain deeper insights into data center operations. For example, AR overlays could be used to visualize real-time sensor readings within the physical infrastructure, while VR simulations could provide a virtual tour of the entire data center environment.
Additionally, we can expect to see greater integration of data visualization with other emerging technologies such as edge computing and Internet of Things (IoT) devices. This convergence of technologies will enable more comprehensive monitoring capabilities that provide real-time insights into edge environments as well as traditional centralized data centers. As a result, we can anticipate more holistic visualizations that encompass a wider range of operational metrics across distributed infrastructure.
In conclusion, the importance of data visualization in data center monitoring cannot be overstated. It plays a crucial role in enhancing visibility into operational metrics, facilitating informed decision making, and driving continuous improvement efforts within the organization. As organizations continue to invest in advanced technologies and embrace new approaches to monitoring, we can expect to see even more sophisticated visualizations that provide deeper insights into data center operations and support the ongoing evolution of infrastructure management practices.
If you’re interested in learning more about the pros and cons of cloud computing for business growth, check out this article. It provides valuable insights into the benefits and challenges of adopting cloud computing for businesses. Understanding the implications of cloud computing can help inform decisions about data center monitoring and infrastructure management.
FAQs
What is data visualization?
Data visualization is the graphical representation of data to help people understand the significance of data by placing it in a visual context. It helps in identifying trends, patterns, and outliers in data.
What is data center monitoring?
Data center monitoring involves the continuous tracking and analysis of the performance and health of a data center’s infrastructure, including servers, storage, networking equipment, and other critical components.
How does data visualization help in data center monitoring?
Data visualization helps in data center monitoring by providing real-time insights into the performance and health of the data center infrastructure. It allows data center operators to quickly identify and respond to issues, optimize resource utilization, and make data-driven decisions.
What are the benefits of using data visualization in data center monitoring?
Some benefits of using data visualization in data center monitoring include improved operational efficiency, faster problem resolution, better resource allocation, enhanced decision-making, and the ability to communicate complex data insights effectively.
What are some common data visualization techniques used in data center monitoring?
Common data visualization techniques used in data center monitoring include dashboards, heat maps, line charts, bar charts, pie charts, and scatter plots. These techniques help in presenting data in a visually appealing and easy-to-understand manner.


